SPECIAL CORE ANALYSIS (SCAL)
In the petroleum industry, special core analysis, often abbreviated SCAL, is a laboratory procedure for conducting displacement experiments on core plugs taken from a petroleum reservoir. Special core analysis is distinguished from "routine (RCAL) or conventional (CCAL) core analysis" by adding more experiments, in particular including measurements of two-phase flow properties, determining relative permeability, capillary pressure, wettability, and electrical properties.
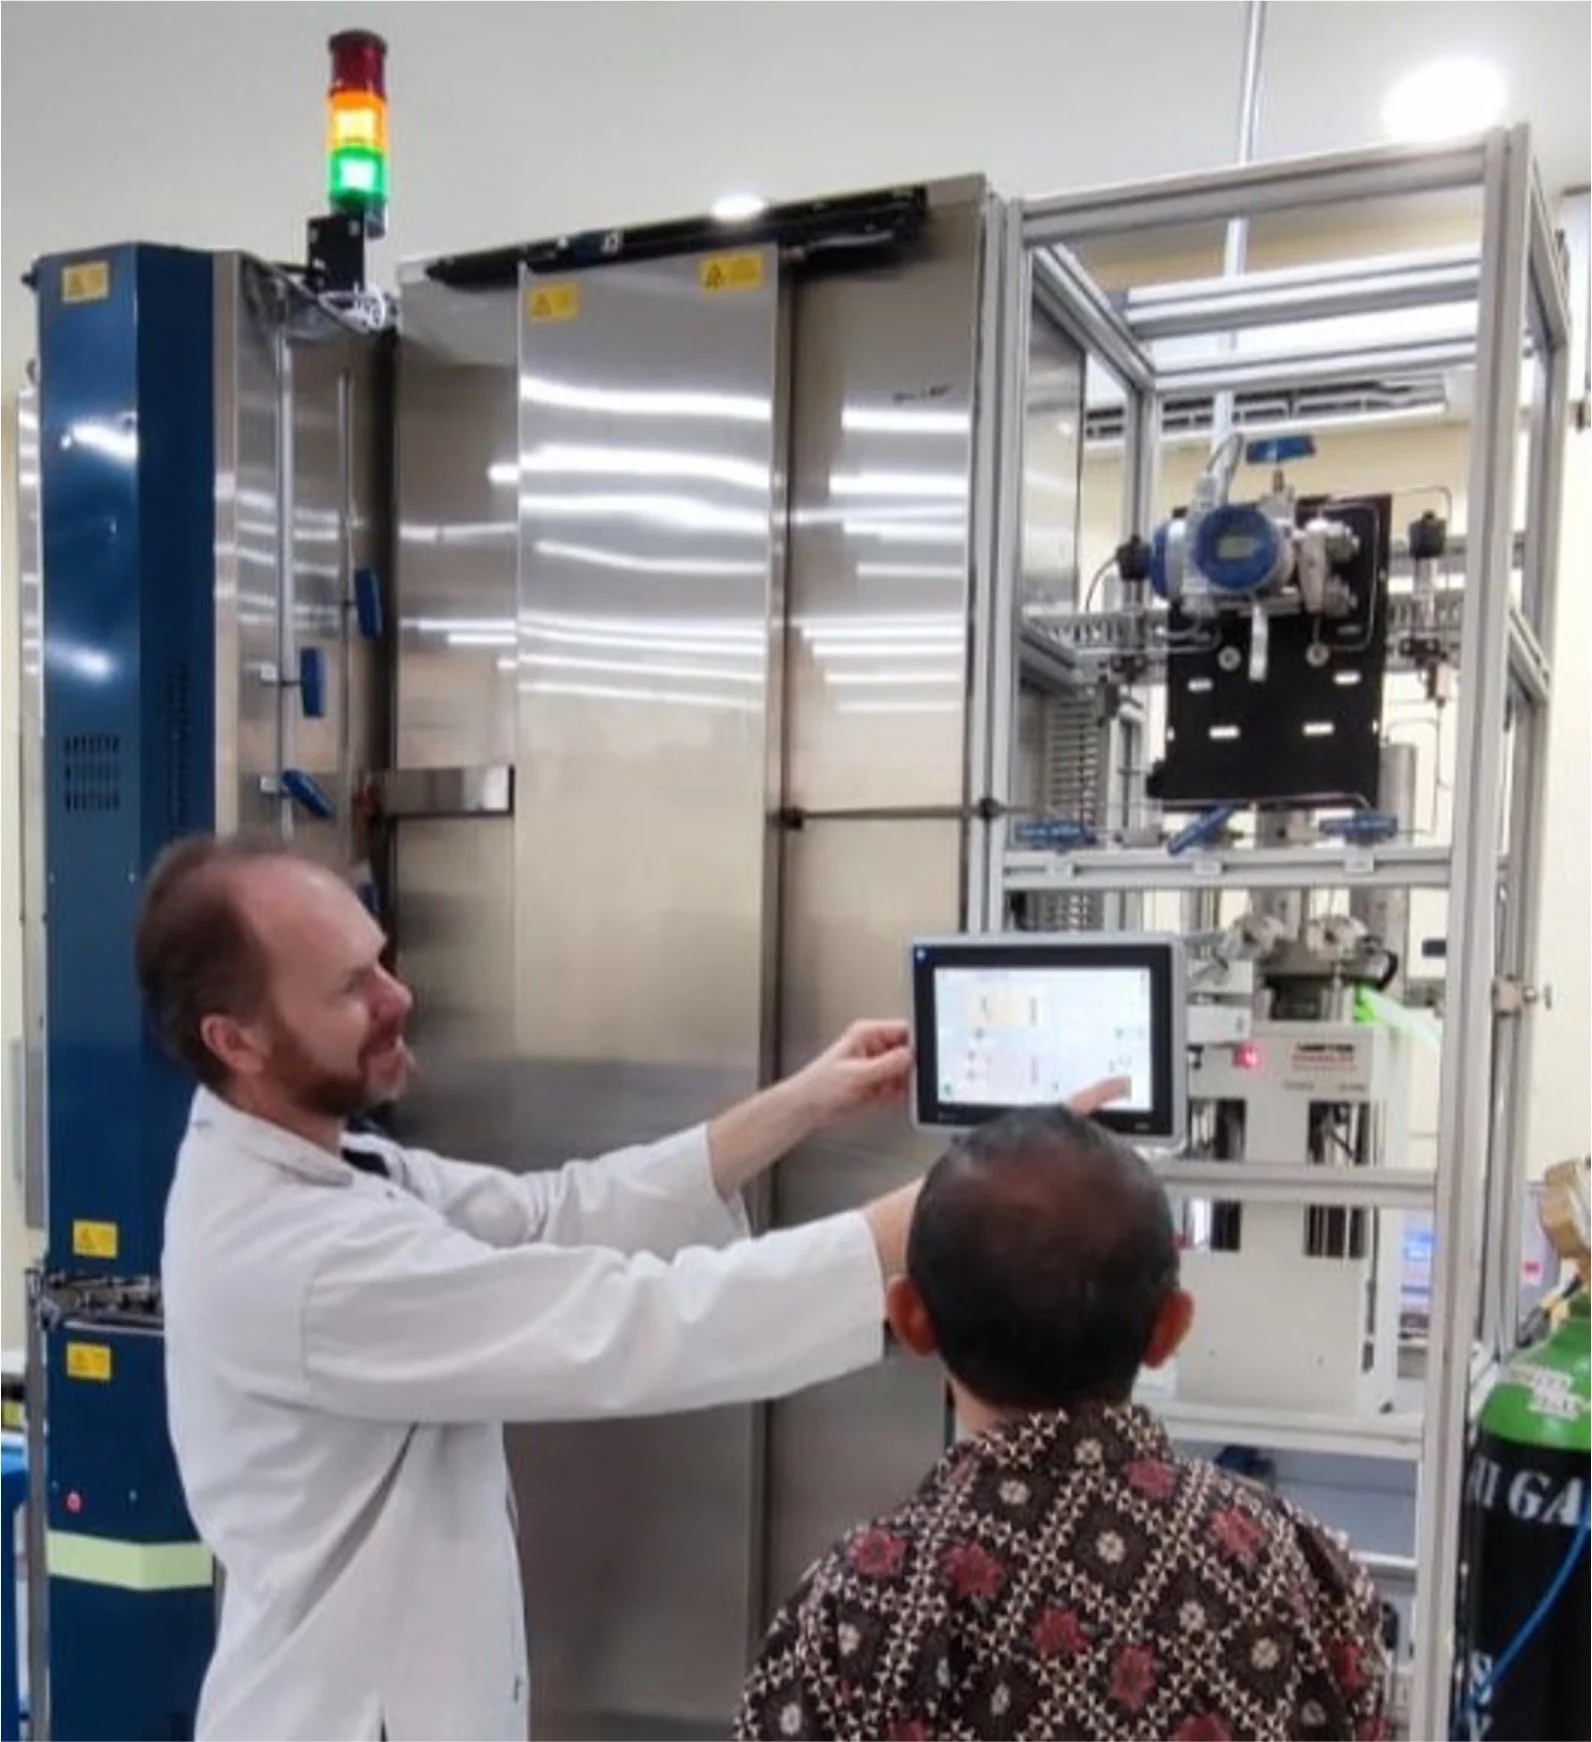
RS Systems’ main focus is to develop services and equipment for special and advanced core analysis. Data from laboratory tests on RS Systems products play a vital role in the development of geological- and reservoir models for:
-
What is the expected volume of gas- or oil in-place? The same type of data can also be used to calculate potential storage volume of CO2 or Hydrogen.
-
Production volume calculations, or estimation of future production profile from a field, or reservoir. Similarly, data from this type of experiment can be used for the determination of compressor capacity in case of injection of fluids in the reservoir zone. This could be different types of injections for EOR purposes, but also for storage purposes.
-
This is the most important product from measurements and application of rock properties data in a field development process.
-
Different displacement methods are tested in the laboratory using different gases, brines or chemicals to improve prouction from a field before potential implementation on a well, or field scale.

CAPILLARY PRESSURE AND ELECTRICAL CONDUCTIVITY
Capillary pressure is important both for storage calculations and production estimates. It is frequently assumed that the forming of a reservoir due to oil migration is a drainage process (i.e. the rock is water wet as oil enters the pores).
Hence, measurement of the water oil drainage capillary pressure curve is important to describe the vertical distribution of water and oil (see figure). The transition zone as shown in the figure must be taken into account for calculations of oil in place. The same principles are valid for a gas reservoir.
By combining measurements of capillary pressure and electrical conductivity of core samples at different water saturation levels, it is possible to estimate water saturations at different depth levels from wire line resistivity logs in the actual reservoir.

Figure inspired by: Saturation and capillary pressures in the transitional zone between the gas- and water leg, after [Spearing, M., C., et al., 2014]
RELATIVE PERMEABILITY
PERMEABILITY
Darcy’s law relates the flow rate Q to the permeability k, cross-sectional area A, viscosity μ, pressure drop (pb - pa), and length L of the material. High permeability corresponds to increased capacity for flow. The dimensions of permeability are length squared, often expressed as darcies (1 darcy = 0.987×10⁻⁸ cm2), millidarcies, or micrometers squared. Some writers use "absolute permeability" or "intrinsic permeability" in place of permeability.
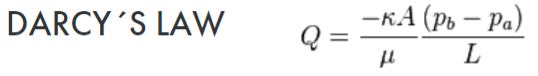

Illustration of planned production versus monitored.
RELATIVE PERMEABILITY
Relative permeabilities are dimensionless functions that usually range between 0 and 1.
During production of oil and gas there will be simultaneous flow of multiple fluids in regions of the reservoir, either by natural flux of water from the water leg, or from injection of fluids into the reservoir.
In special cases, such as injection of slugs of both water and gas (WAG), there can also be regions where the three phases (water-oil-gas) flow simultaneously.
The above processes are simulated in the laboratory using specialized equipment, where the goal is to understand the displacement processes. This will then provide reliable results, which be processed by a field simulator for Field Production Estimates, and the best possible basis for the Plan for Development and Operation (PDO) for a Field.

Production from the Oseberg Field in the North Sea. Source: Norwegian Offshore Directorate.
IMPROVED OIL RECOVERY (IOR)
As an illustration of the potential value creation, with RS Systems products contribution, we use the Ekofisk development:
The illustration shows the originally estimated, and the updated production profiles for Ekofisk, a Norwegian chalk field in the Southern North Sea. Initially, the intention was to produce oil by primary depletionsince it was believed that pressure maintenance by water injection would harm the displacement process.
As a consequence, the initially estimated recovery factor for the field was very low with an estimated shut down of the field in 2010.
However, extensive laboratory tests were carried out to study the effect of water injection as a displacement mechanism. These tests concluded that water injection would greatly enhance production.
As can be seen water injection was initiated in the mid 80s, and this has significantly improved the recovery from the field.

Source NPD
C02 INJECTION AND STORAGE
Since 1996, CO2 from gas production on the Norwegian continental shelf has been captured and reinjected into sub-seabed formations. The CO2 management projects at Sleipner and Snøhvit are the only CO2 management projects in operation in Europe today and are unique in the offshore industry:

Illustration of CO2 injection and storage on the Sleipner field in the North Sea. The gas from the field has a high content of CO2. During processing of the gas on the platform, CO2 is separated out and injected into the Utsira formation far below the seabed. Since 1996, up to 1 million tonnes of CO2 a year has been stored here. Equinor (former Statoil) is the operator for Sleipner (Photo: Alligator film/BUG, Equinor).
Data from RS Systems Capillary Pressure units provide vital data to understand
• CO2 storage potential.
Data from the RS Systems EOR and Relative Permeability units provide necessary data forestimation of;
• Compressor capacity.
• Potential additional oil, or gas potential if CO2 injection is part of an EOR plan.
CCS requires large investments. RS Systems participate in the development of new technologies to lower investment and operating costs and make this climate tool relevant for additional emission sources.

Illustration of CCS (Photo Gassnova)